K3s Homelab
A production-grade Kubernetes cluster on a Mac Mini M1. Provisioned, hardened, monitored, and operated by an AI infrastructure assistant. This page is served from the cluster it documents.
Architecture
Hardware
| Component | Specification |
|---|---|
| Machine | Mac Mini (Macmini9,1) |
| Chip | Apple M1 — 8 cores (4 performance + 4 efficiency) |
| Memory | 8 GB |
| Storage | 228 GB SSD |
| OS | macOS 26.2 (Darwin 25.2.0, arm64) |
Stack
| Layer | Technology | Version |
|---|---|---|
| Container Runtime | Docker Desktop | v29.2.1 |
| Kubernetes | K3s via k3d | v1.33.6+k3s1 |
| Ingress | Traefik | v3.6.8 |
| Monitoring | Prometheus + Grafana | kube-prometheus-stack v82.2.0 |
| Tunnel | Cloudflare Tunnel (QUIC) | cloudflared 2026.2.0 |
| DNS & TLS | Cloudflare | Universal SSL |
| Operator | Jarvis — AI infrastructure assistant | — |
Traffic Flow
Internet → Cloudflare Edge (TLS termination)
        → Cloudflare Tunnel (QUIC, outbound-only)
        → cloudflared pod (tunnel namespace)
        → ClusterIP Service
        → Application pod (workloads / monitoring namespace)
Zero inbound ports. No public IP exposure. All external traffic enters through an outbound-only tunnel to Cloudflare's edge network, routing directly to ClusterIP services. Traefik handles internal ingress routing.
Cluster Provisioning
K3s is a lightweight, CNCF-conformant Kubernetes distribution. It is Linux-only — k3d runs it inside Docker containers on macOS, transparent to all Kubernetes operations.
$ k3d cluster create homelab \
    --port "80:80@loadbalancer" \
    --port "443:443@loadbalancer" \
    --k3s-arg "--disable=traefik@server:0" \
    --wait
Default Traefik disabled at cluster creation. A manually configured instance is deployed later with HTTP-to-HTTPS redirect, TLS, and the API dashboard disabled.
$ kubectl get nodes -o wide
NAME                   STATUS   ROLES                  VERSION        INTERNAL-IP   OS-IMAGE
k3d-homelab-server-0   Ready    control-plane,master   v1.33.6+k3s1   172.18.0.2    K3s v1.33.6+k3s1
Security Hardening
Namespace Isolation
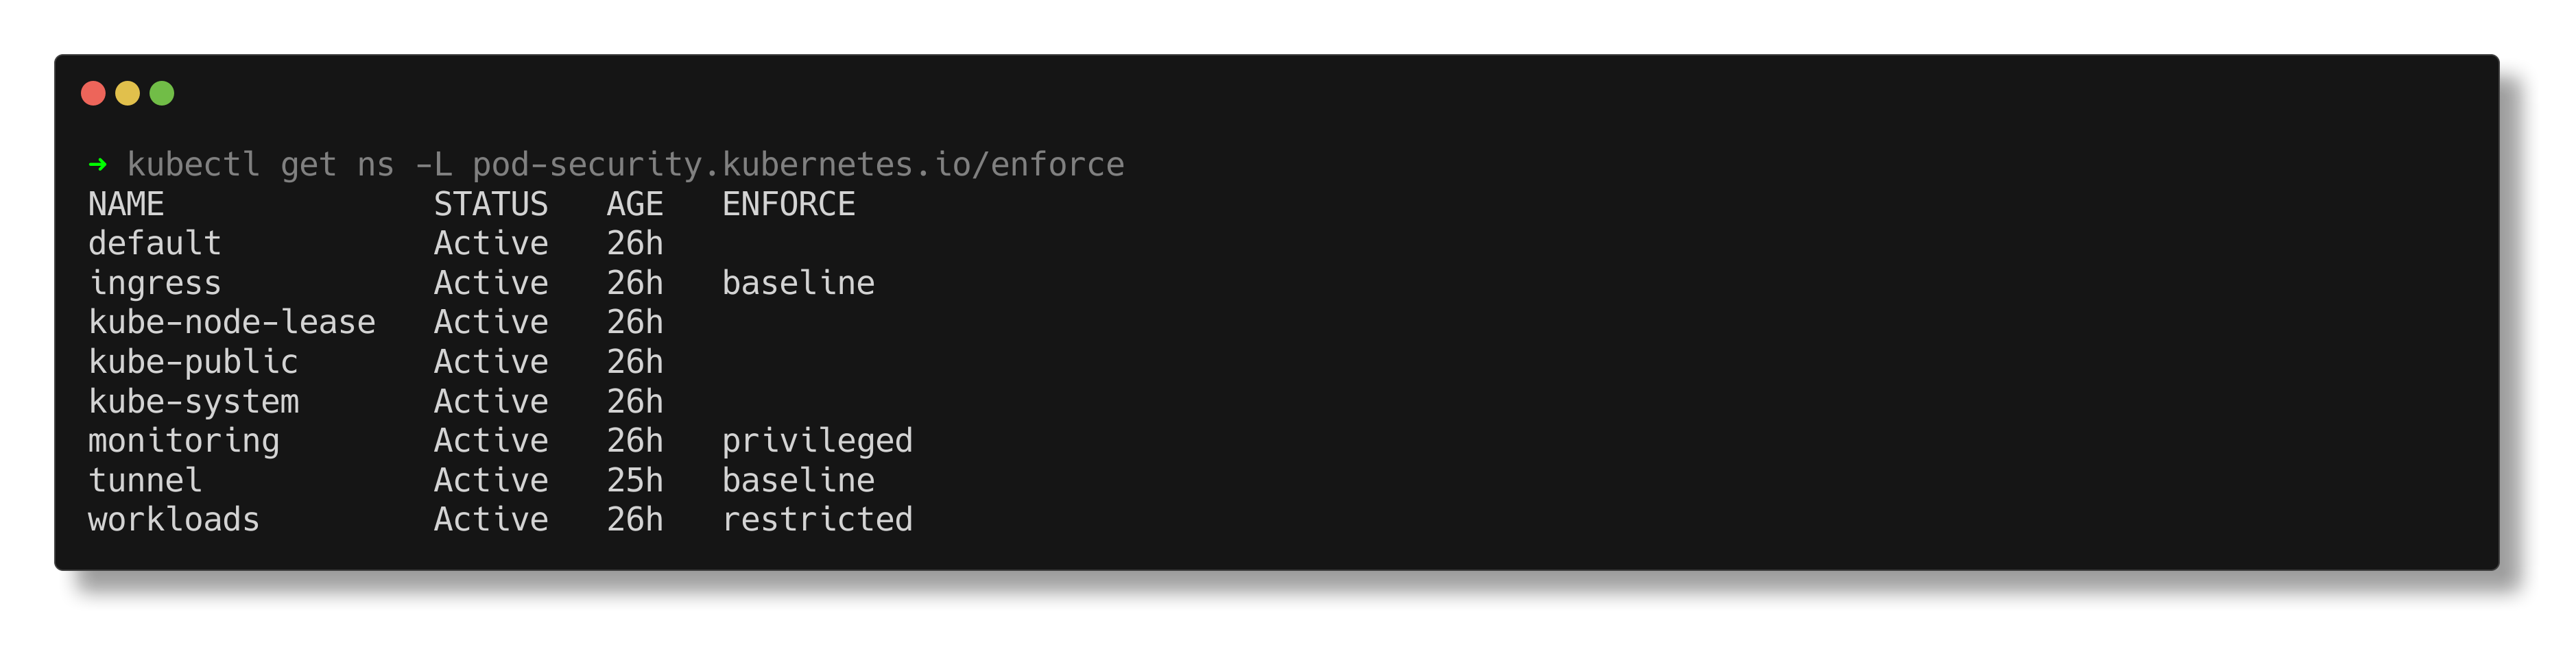
Four dedicated namespaces with Kubernetes Pod Security Standards (PSS) enforced at the namespace level via labels.
| Namespace | PSS Level | Purpose |
|---|---|---|
workloads | Restricted | Application pods — non-root, read-only rootfs, all capabilities dropped |
monitoring | Privileged | Prometheus, Grafana, node-exporter — requires host access for metrics collection |
tunnel | Baseline | Cloudflare Tunnel connector — outbound-only traffic to Cloudflare edge |
ingress | Baseline | Traefik ingress controller |
Network Policies
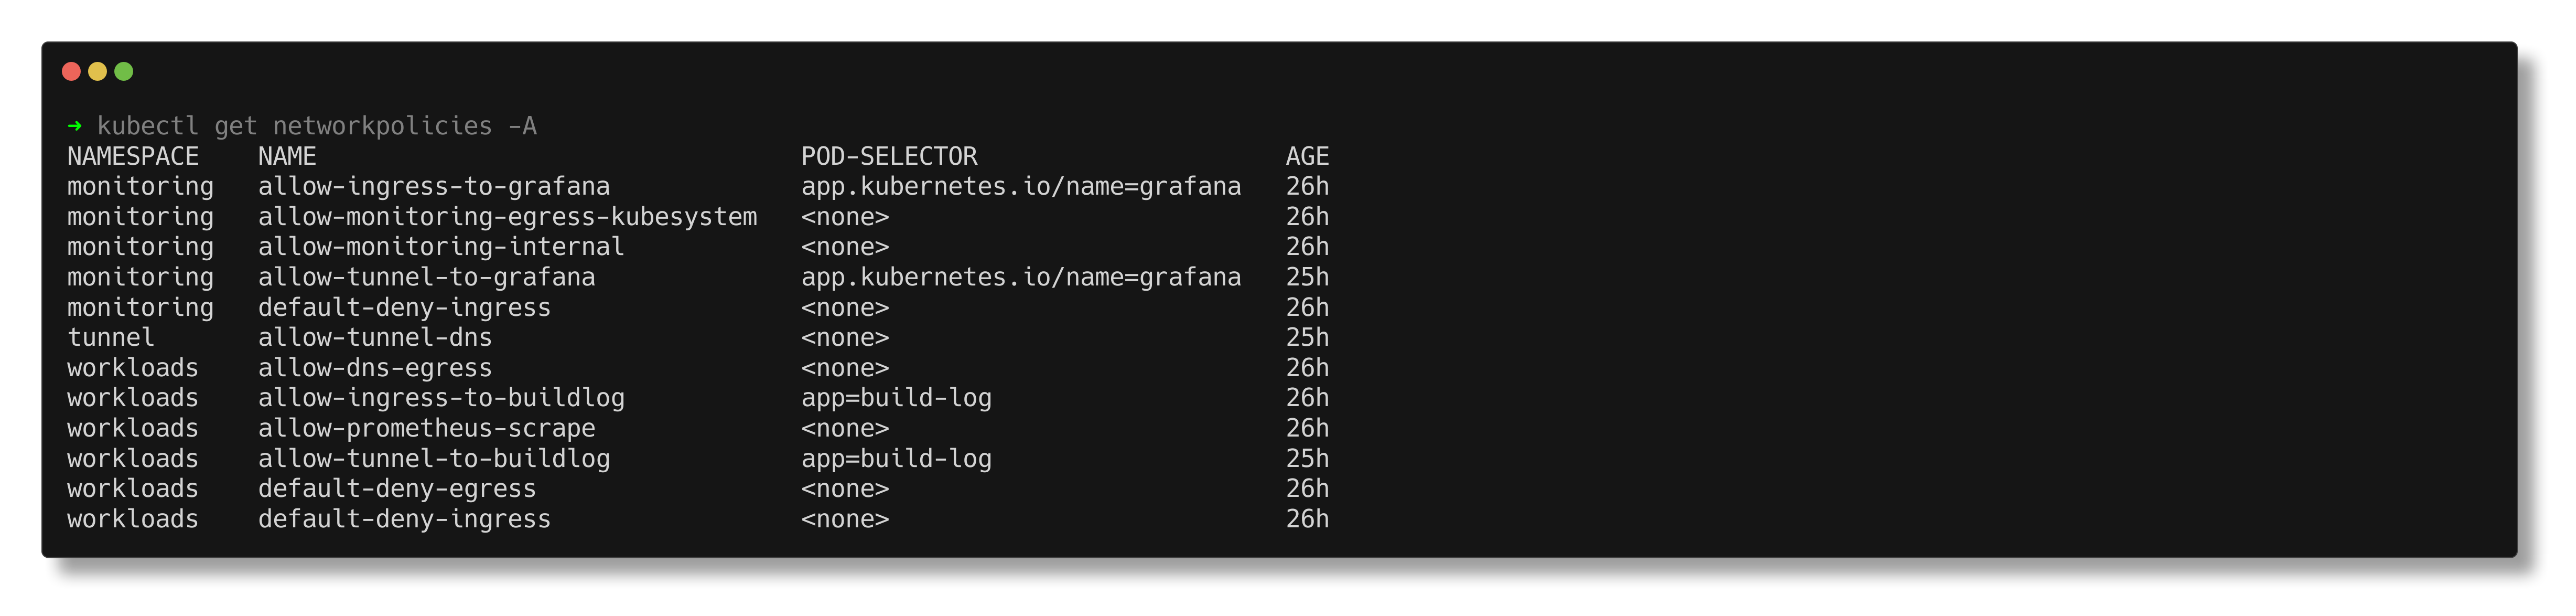
Default deny ingress and egress on all workload and monitoring namespaces. Every permitted traffic flow is an explicit, scoped rule.
| Rule | Namespace | Permits |
|---|---|---|
| default-deny-ingress | workloads, monitoring | Block all unlisted ingress |
| default-deny-egress | workloads | Block all unlisted egress |
| allow-tunnel-to-buildlog | workloads | Tunnel → build-log pod on port 8080 |
| allow-tunnel-to-grafana | monitoring | Tunnel → Grafana pod on port 3000 |
| allow-ingress-to-buildlog | workloads | Traefik → build-log pod on port 8080 |
| allow-ingress-to-grafana | monitoring | Traefik → Grafana pod on port 3000 |
| allow-dns-egress | workloads | DNS resolution via kube-system |
| allow-tunnel-dns | tunnel | DNS resolution, egress to workloads:8080 and monitoring:3000, QUIC to Cloudflare edge |
| allow-monitoring-internal | monitoring | Inter-pod communication within monitoring |
| allow-monitoring-egress-kubesystem | monitoring | Monitoring → kube-system for kubelet and API server metrics |
| allow-prometheus-scrape | workloads | Prometheus → workload pods for metrics |
RBAC & Pod Security
| Control | Implementation |
|---|---|
| Service accounts | Dedicated per workload — build-log-sa for the build log, scoped accounts for monitoring components |
| Cluster-admin | No workload runs with cluster-admin privileges |
| Monitoring access | Read-only ClusterRole — nodes, pods, services, metrics endpoints |
| Non-root execution | Enforced by PSS restricted level (UID 101) |
| Read-only root filesystem | Enforced. Writable paths via emptyDir volumes only. |
| Capabilities | All dropped. No privilege escalation. |
Observability
Deployed via kube-prometheus-stack Helm chart — Prometheus, Grafana, node-exporter, kube-state-metrics, and the Prometheus Operator in a single deployment.
$ helm install monitoring prometheus-community/kube-prometheus-stack \
    --namespace monitoring \
    --values manifests/monitoring/kube-prometheus-values.yaml \
--wait| Component | Purpose |
|---|---|
| Prometheus | Metrics collection and storage. 7-day retention, 5Gi persistent volume. |
| Grafana | Dashboards. Anonymous read-only access enabled. 28 dashboards provisioned. |
| Node Exporter | Host-level hardware and OS metrics |
| Kube State Metrics | Kubernetes object state as Prometheus metrics |
| Prometheus Operator | Manages Prometheus configuration via CRDs |
$ kubectl get pods -n monitoring
NAME                                                   READY   STATUS    RESTARTS   AGE
monitoring-grafana-67b8c4968d-zx775                    3/3     Running   0          14m
monitoring-kube-prometheus-operator-5888c6f4d6-z467s   1/1     Running   1          17h
monitoring-kube-state-metrics-66dddb6c8f-mxh9d         1/1     Running   1          17h
monitoring-prometheus-node-exporter-k766h              1/1     Running   1          16h
prometheus-monitoring-kube-prometheus-prometheus-0     2/2     Running   3          17h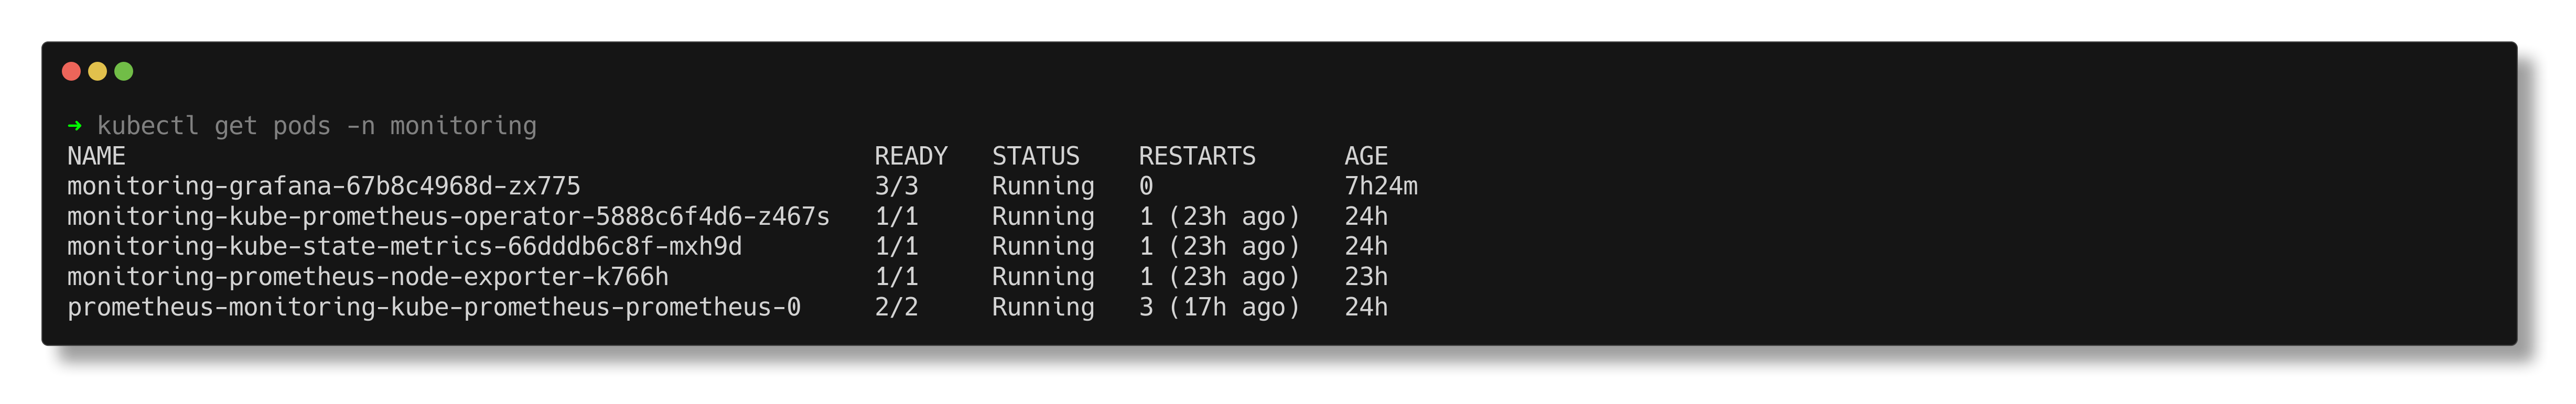
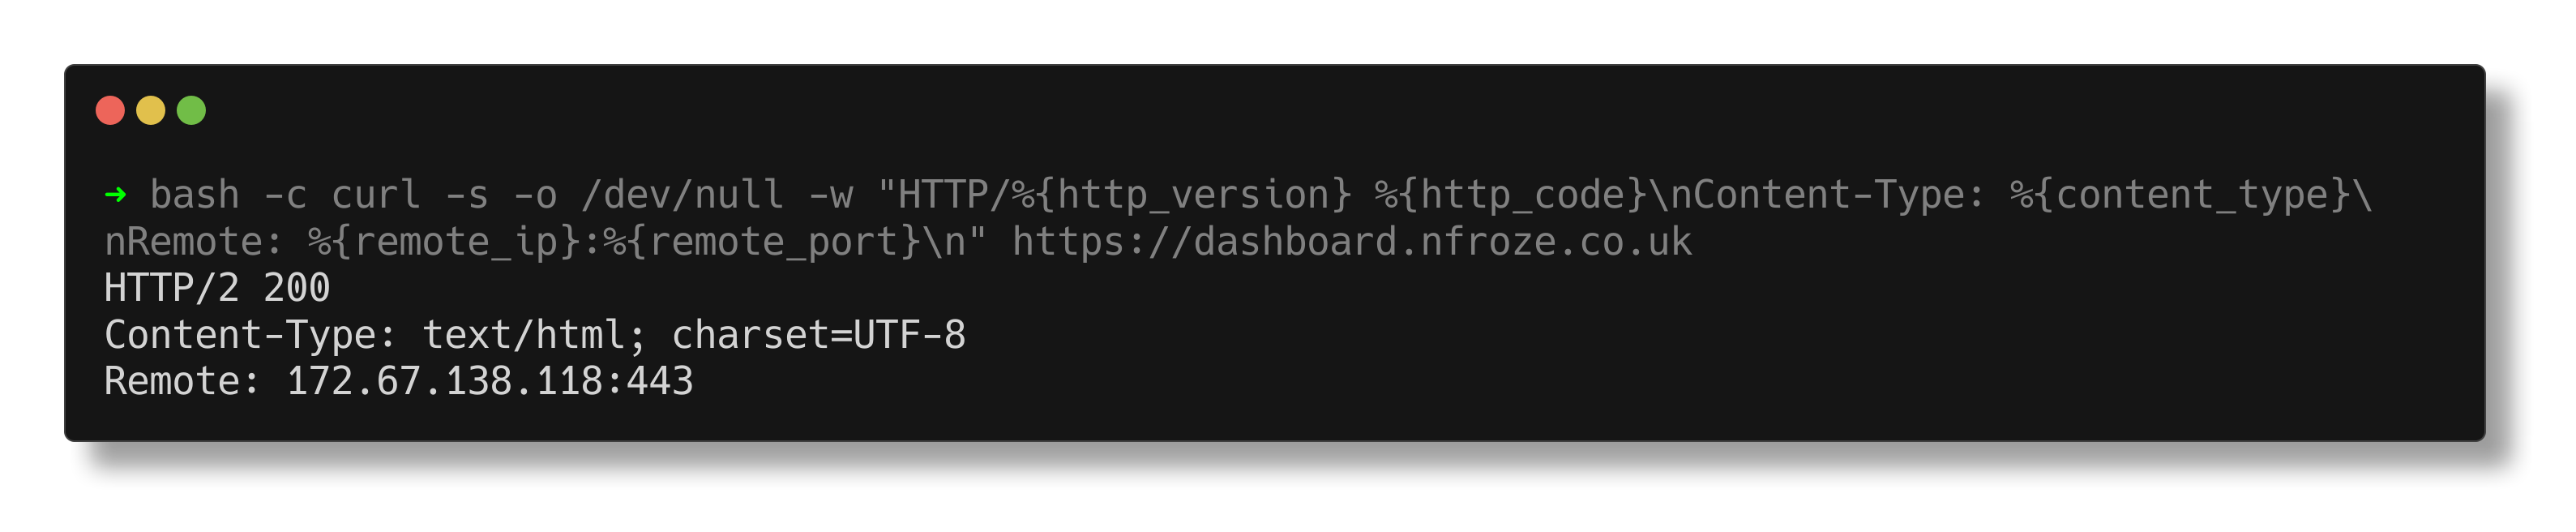
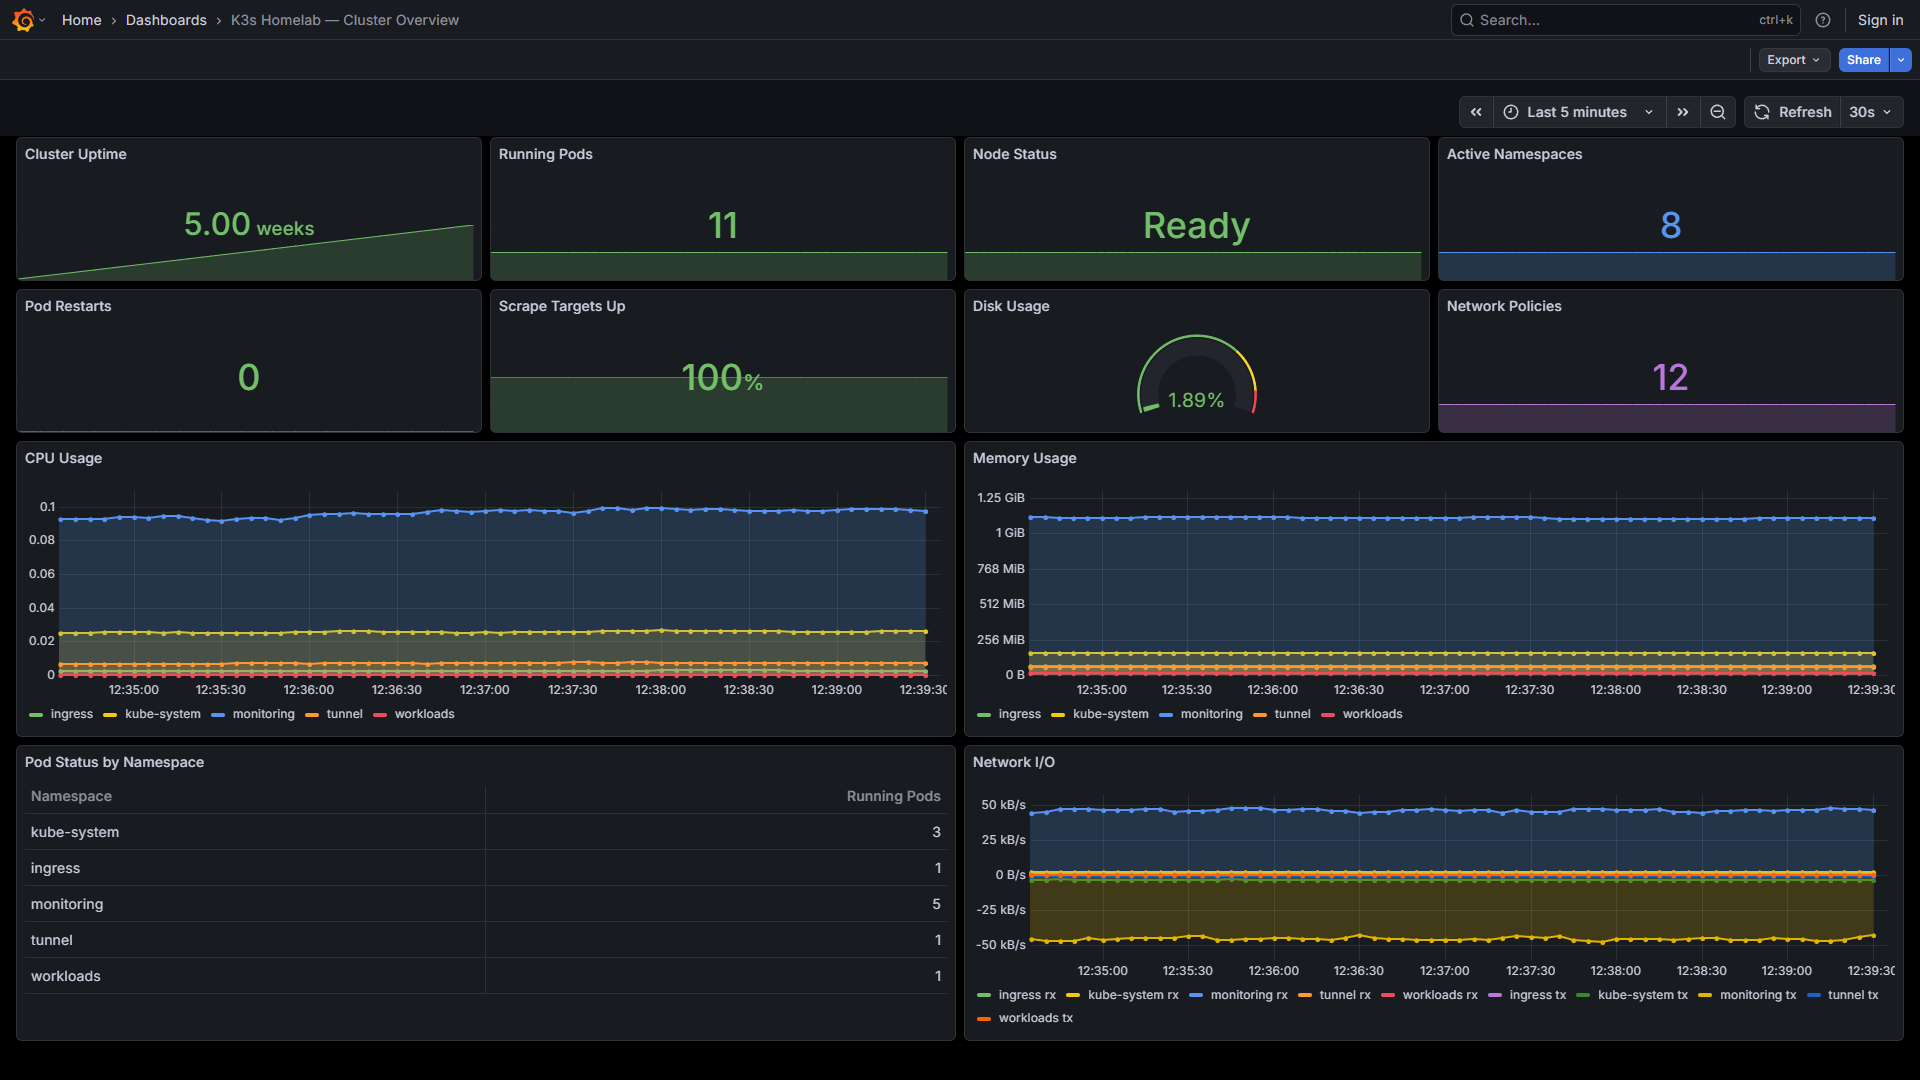
Grafana is publicly accessible at dashboard.nfroze.co.uk with anonymous read-only access. 28 dashboards total — one custom Cluster Overview homepage, 27 provisioned by the Helm chart covering compute resources, networking, API server, kubelet, and Prometheus self-monitoring.
Build Log Deployment
This site runs as an Nginx container in the workloads namespace. The static files are baked into a custom Docker image — a single, versioned, immutable artefact.
FROM nginxinc/nginx-unprivileged:1.27-alpine

COPY nginx.conf /etc/nginx/conf.d/default.conf
COPY index.html /usr/share/nginx/html/
COPY css/ /usr/share/nginx/html/css/
COPY images/ /usr/share/nginx/html/images/

EXPOSE 8080
The unprivileged Nginx variant runs as UID 101 on port 8080 — compliant with the restricted Pod Security Standard without modification. Security headers (X-Frame-Options, X-Content-Type-Options, CSP, Referrer-Policy) are set in the Nginx configuration.
| Pod Security Control | Value |
|---|---|
| runAsNonRoot | true |
| runAsUser | 101 |
| readOnlyRootFilesystem | true |
| allowPrivilegeEscalation | false |
| capabilities | drop: ALL |
| seccompProfile | RuntimeDefault |
$ kubectl get pods -n workloads
NAME                        READY   STATUS    RESTARTS   AGE
build-log-cc4948cdb-jcqwm   1/1     Running   0          18m

$ curl -s -o /dev/null -w "HTTP %{http_code}" https://k3s.nfroze.co.uk
HTTP 200
AI Operations
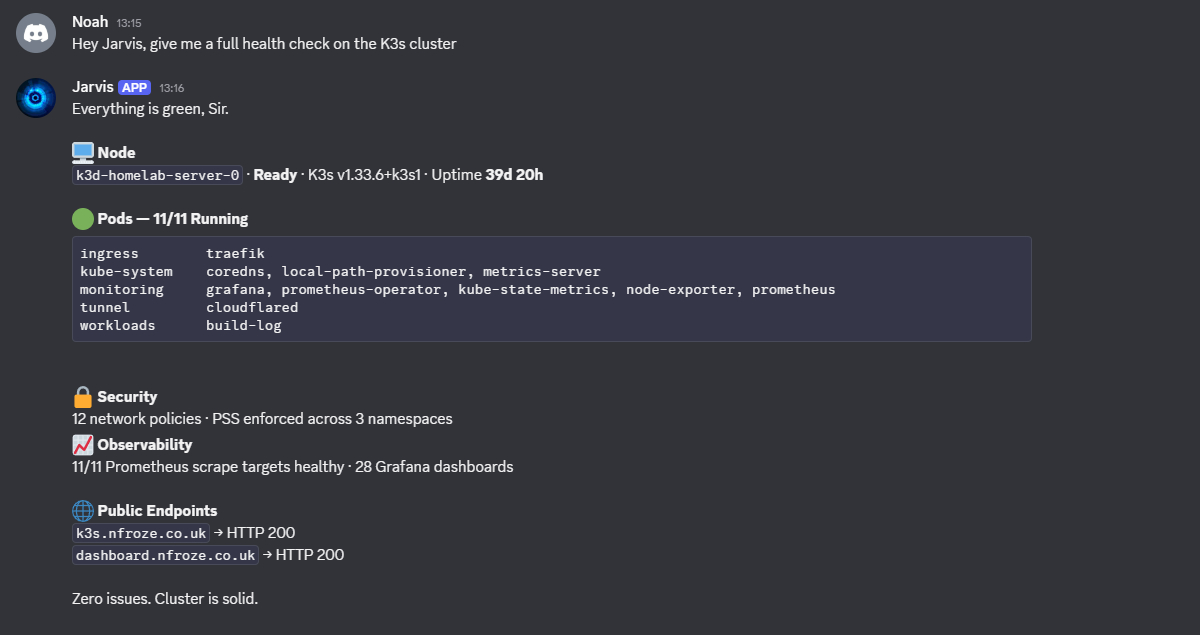
Jarvis is an AI infrastructure operator with full shell access to the host and the Kubernetes API. Cluster health queries are handled in real time via Discord — live kubectl output, not cached responses.